Download this file. Complete it and then submit it to Autolab. Note: We are only providing the starter code so you can use the graphics framework. There are no test cases for the Autograded portion and you should write your own test cases.
Questions
1. patternedMessage(message, pattern) [30 pts]
See here.2. topLevelFunctionNames(code) [35 pts]
See here.3. drawGradient(canvas, x0, y0, x1, y1) [15 pts]
Write the function drawGradient that takes 5 values – a canvas, a left, top, right, and bottom – describing a rectangular region of the canvas, and fills this region with a drawing of a gradient. This is achieved by drawing a series of rectangles, each a slightly different shade than the previous, uniformly changing from one color on the left to another color on the right. The gradient should progress black to white, using only 10 rectangles. Here is a screenshot to help (click on the image to see a larger version):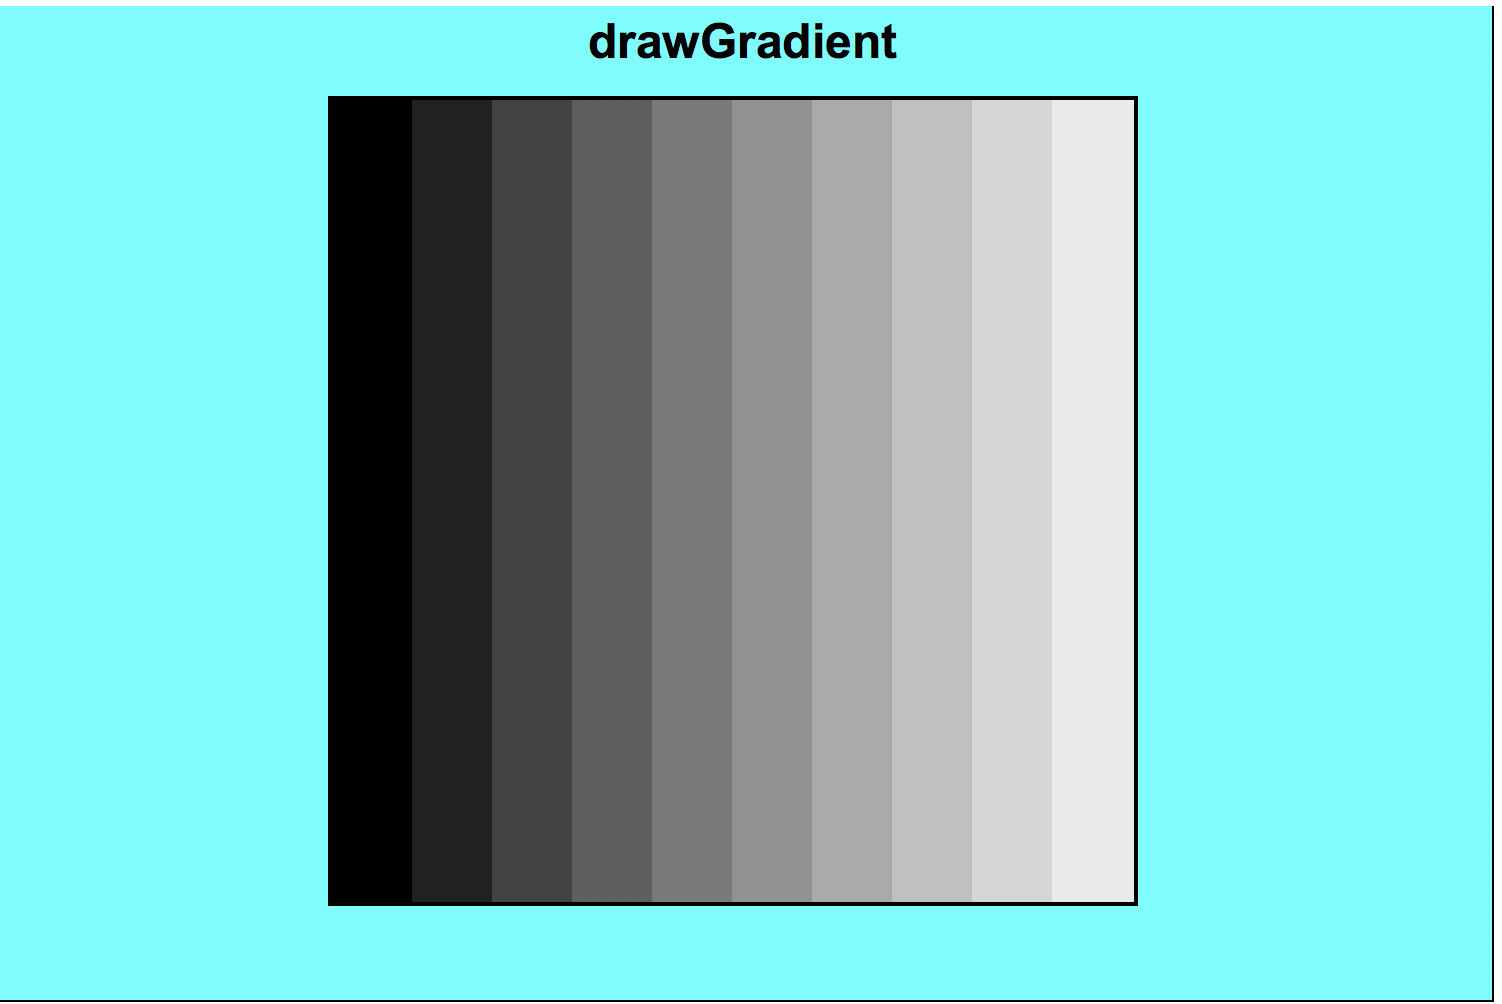
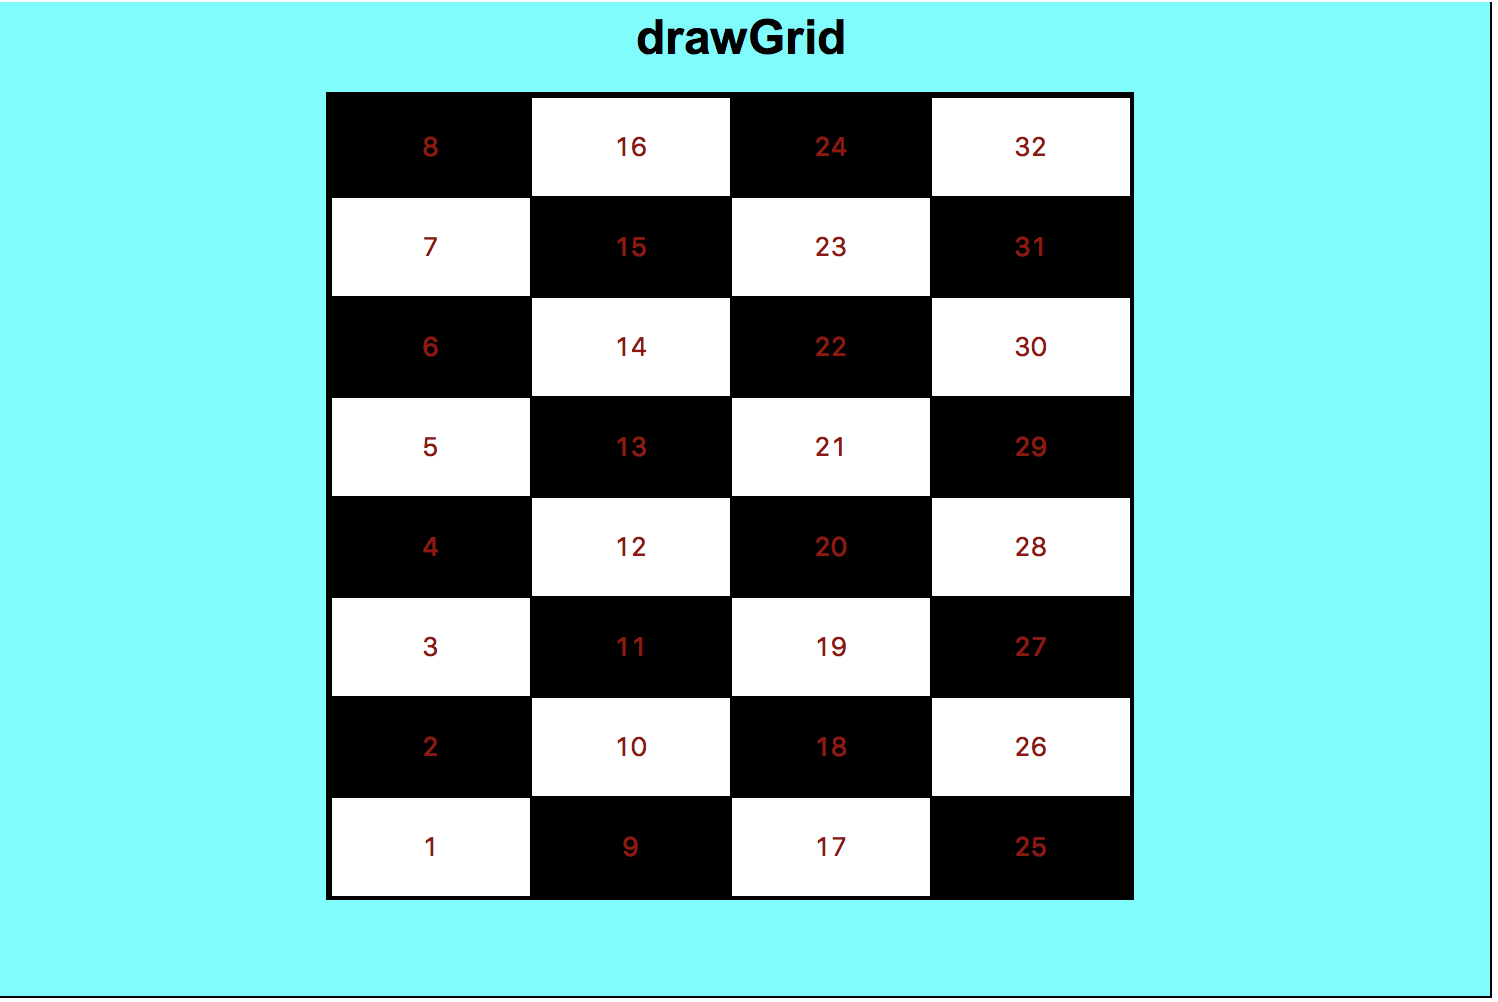
4. drawGrid(canvas, x0, y0, x1, y1) [20 pts]
Write the function drawGrid that takes 5 values – a canvas, a left, top, right, and bottom – describing a rectangular region of the canvas, and fills this region with a drawing of a rectangular grid. The grid should have 8 rows and 4 columns, and the cells should alternate black and white. Also, each cell will be labeled with a number (note that you can provide a number as the text value in create_text). The numbers start in the bottom-left cell and proceed upwards and then rightwards. Here is a screenshot to help (click on the image to see a larger version):